Previously I had written a simple clustering algorithm using correlations to look at rough “relationships” between equities, whether real or “accidental”. I had evaluated this on the S&P 500.
I decided to do a much wider evaluation on all US equities with average volume > 200K and market cap > 500M + the ETFs. This subset of equities results in about ~2800 assets or 3,780,000 pairs to be evaluated. Evaluating this in R was impractical, so evaluated in Java. The evaluation time was in seconds rather than the days R might have required.
To discover stronger relationships evaluated both the correlation and Augmented Dickey-Fuller test on all pairs, keeping pairs with adf p-value < 0.05. Additionally did cross-validation against prior years, throwing away pairs that did not fit in the cross-validation period.
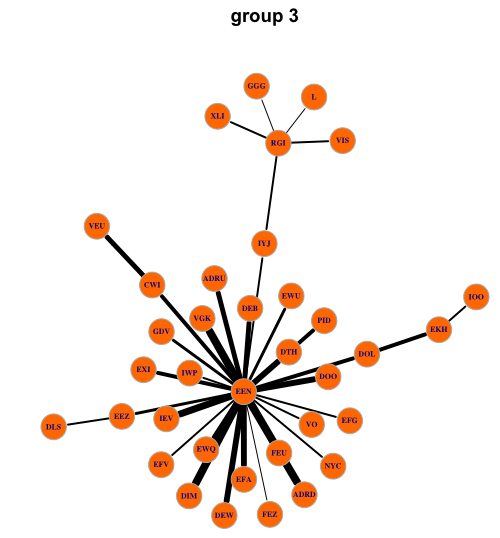
I then used my clustering algorithm (outlined in a previous post) to determine networks of maximally related assets.
This resulted in ~1000 pairs (of the original ~4 million pairs). Some portion of these pairs “make sense” and others are complete surprises. That said, given the large number of series it would not be a surprise to find “unrelated” assets that are relatively cointegrated over the test period.
It generated ~50 clusters, here is one at random:
Trading The Pairs
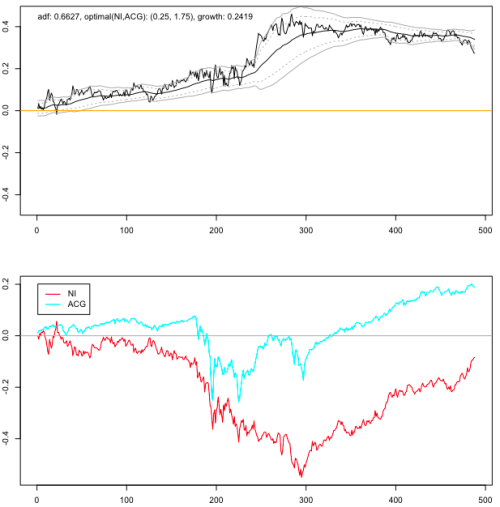
The beauty of cointegrated series is that they are much easier to model then series with heteroscedasticity or trending mean. There are a number of approaches to trading pairs (or larger cointegrated portfolios). Before getting to this, first want to illustrate a non-cointegrating spread:
We can see that the spread between NI and ACG has a spread that is growing with time from the axis. The ideal spread is one that oscillates around a constant mean (generally 0). The above can be traded, but would involve, first a view that the there is a long run beta differential of ~0.25 and weighing the basket appropriately.
Many look at the relative “beta” (i.e. the slope of the long run cumulative returns) for each asset and determine weights based on a linear regression. That approach works well if trends follow a near linear path over the observation period.
A better approach is to find the weights such that the spread “spends as much time above the origin as below the origin” (ok, it’s a rough heuristic I came up with). This can be expressed as:
Basically the above is “saying”: find the integral of some weighting of the spread function such that the area is as close as possible to 0 (i.e. we have balanced sweep above and below the origin). The constraints make sure that the weights don’t go to 0.
If it is Cointegrated
In theory this is a much simpler scenario where we can chose equal and offset weights (-1, 1) and then analyse the resulting spread for entry and exit (technically one may still adjust the weights to adjust for drift depending on MR period one is focusing on).
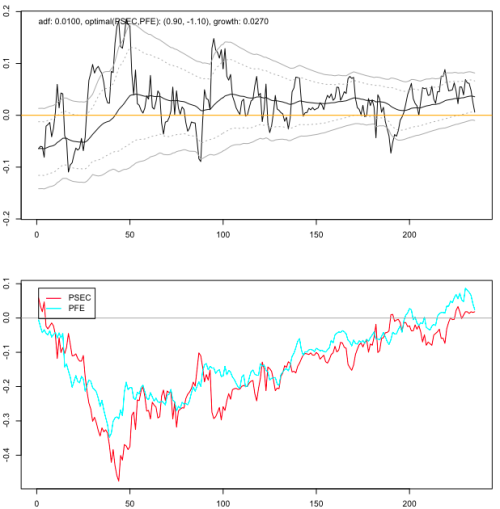
Next, we want to look for mean-reversion patterns or at least identify levels likely to mean revert conditioned on the past. Here is a pair that is cointegrated for this period:
The typical approach is to normalize the spread to standard deviations and enter reverting trade when 2 SD or another suitable threshold is realized. Some basic observations of momentum and vol can be used to decide precisely when to enter.
Another approach used is to calibrate some descendent of the Ornstein-Uhlbleck MR model to the desired level of MR and use as a driver for entry. I’m not trading pairs at this time, so I’m not sure whether it is worth adopting a MR model. From past experience with these models, they are hard to calibrate and require significant modification to match empirical behavior, even loosely.
Beyond Pairs
We use pairs to provide a more desirable process statistically, more amenable to MR analysis. There is a much wider universe of possibilities present in “spread baskets”. By “spread baskets” am refering to collections of more than 2 assets that are fractionally long or short, producing a tightly cointegrated return.
Determining such baskets is very complex for a number of reasons:
- size of search grows at roughly O(N^k), where k is the size of basket and N the number of assets
- one needs to determine optimal weights (expensive NLP)
- optimal weights need to be tested in cross-validation
Mitigating the worst case is:
- can throw away assets with low correlations
To give an example, if we consider the 3-asset case on 2000 stocks, the worst case search would involve 2.6 billion combinations to check. The correlation matrix may well make this viable however.


Quick question : what do you use to draw your clusters ( I mean really the charting module, not the algo)? Is there an R package or something to do this, or something you have coded yourself ?
Thx
I use the R igraph package. igraph has bindings to both R and python. In this case I did my analysis in Java and dumped the graph in the graphml XML format. This can be loaded into R and evaluated.
Nice post. Adding to Quantivity blogroll.
MR is a wonderfully deep and rich domain for analysis and trading; you may wish to consider a few optimization tricks; say alternative filtering (e.g. zero cross) or alternative pruning (e.g. stepwise).
Thanks. Zero cross is probably a better heuristic than min Integrate [spread[t], {t,0,T}]^2 as the later will negatively bias for large deviations in one direction. As for stepwise, not sure what you mean.
I’ve not focused on MR for pairs or spread baskets before. In the FX and IR markets have modelled MR for single assets (though cointegration can be considered there as well). On a single asset much harder given evolving mean. So evaluating pairs or spread baskets looks a lot “easier”, though I’m sure is a lot more competitive.
What time frame did you use to search for your pairs?
Do you have any recommendations for how timeframes should be chosen when looking for pairs that MR. Is the intraday timeframe worth looking at?
There are relationships at different levels of granularity as you can imagine. I do look at both intra-day and multi-day convergence / divergence plays. Ultimately it depends on the assets in question. One cannot really force a period of convergence to a tighter period than is naturally present in the pairing. I tend to work with baskets of 3 or more to get better convergence behavior.
Some models of trading do not require complete convergence rather look at convergence from a high SD band to an inner band around a mean with non-zero drift. Hence the periodicity of oscillations in such a model will be different from a setup where you are looking at raw spread 0 crossings. So determining the timeframe depends on your model of convergence, and for each model there are approaches to determine this either by solving for a coefficient or just evaluating the distribution of periods empirically over an evaluation set.